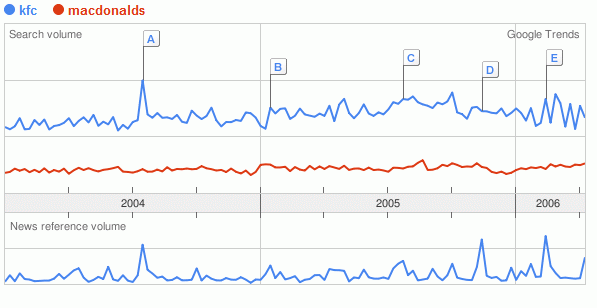
Okay, Google’s latest project Google Trends is pretty entertaining.
Type in a search term like, ‘hurricane katrina‘ and get back a graph of search volume over time, and a table of the cities where the search term was most popular. The results are normalised, i.e. the table is ordered by searches for ‘hurricane katrina’ over the total searches for that city. The labels on the graph correlate the dates of news articles.
Or view a comparison by comma separating search terms, ‘coke, pepsi‘ or ‘kfc, macdonalds‘.

Post a Comment